See It In Action
What Your Leadership
Team Will Walk Away With.
Together, the Cogitant AI Exposure Index™ and AI Advantage Index™ produce board-ready deliverables — your risk and advantage scores, the revenue at stake and the opportunity, your biggest gaps, and a prioritized plan. Here's what your leadership team actually walks away with.
View Full Size →
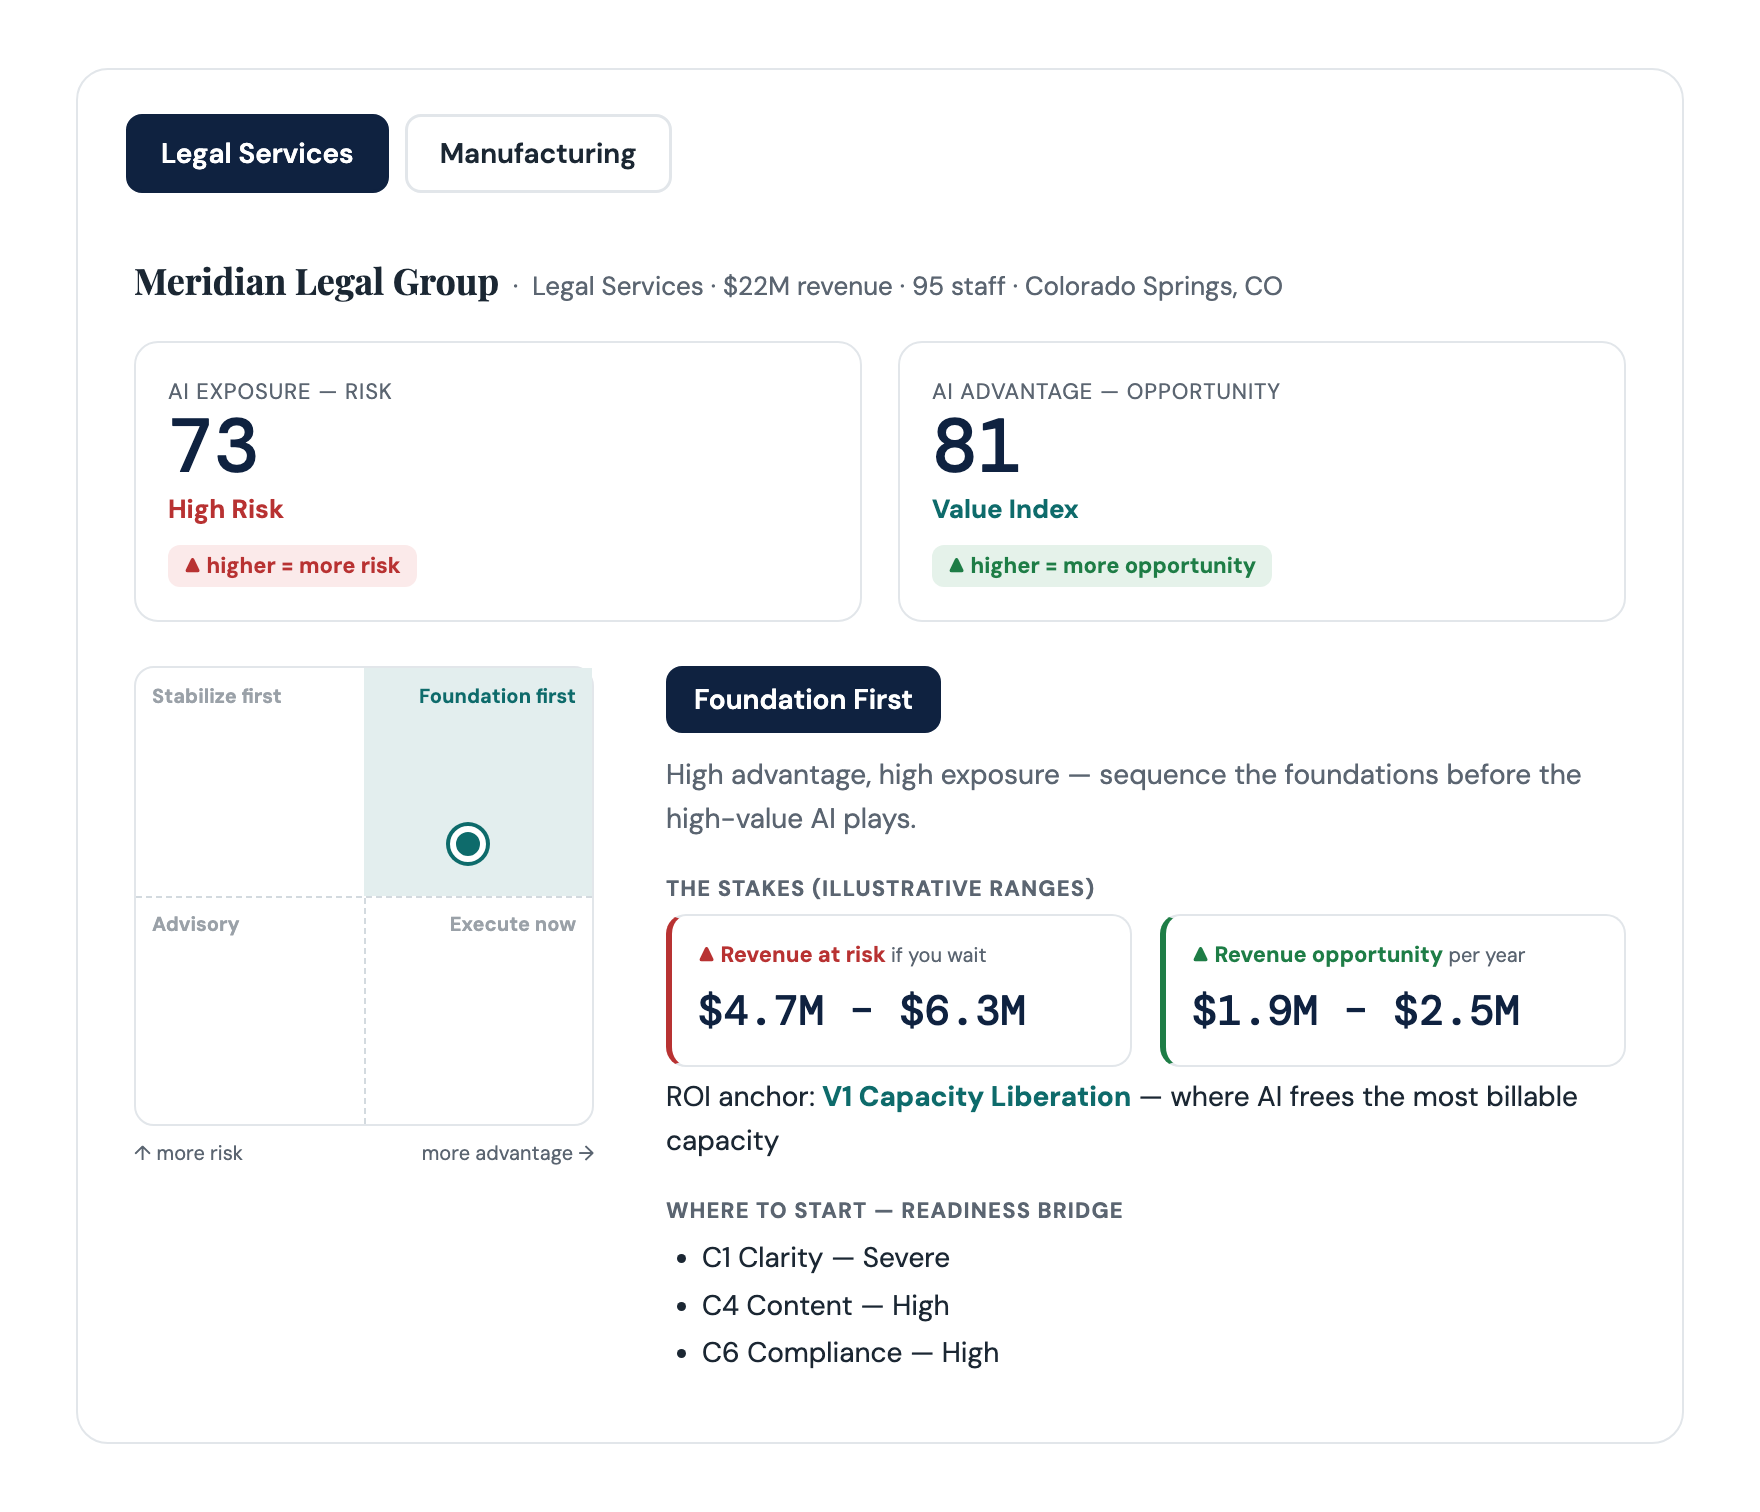
Risk × Advantage Snapshot
Both scores, your strategic position, and the revenue at stake — at a glance
View Full Size →
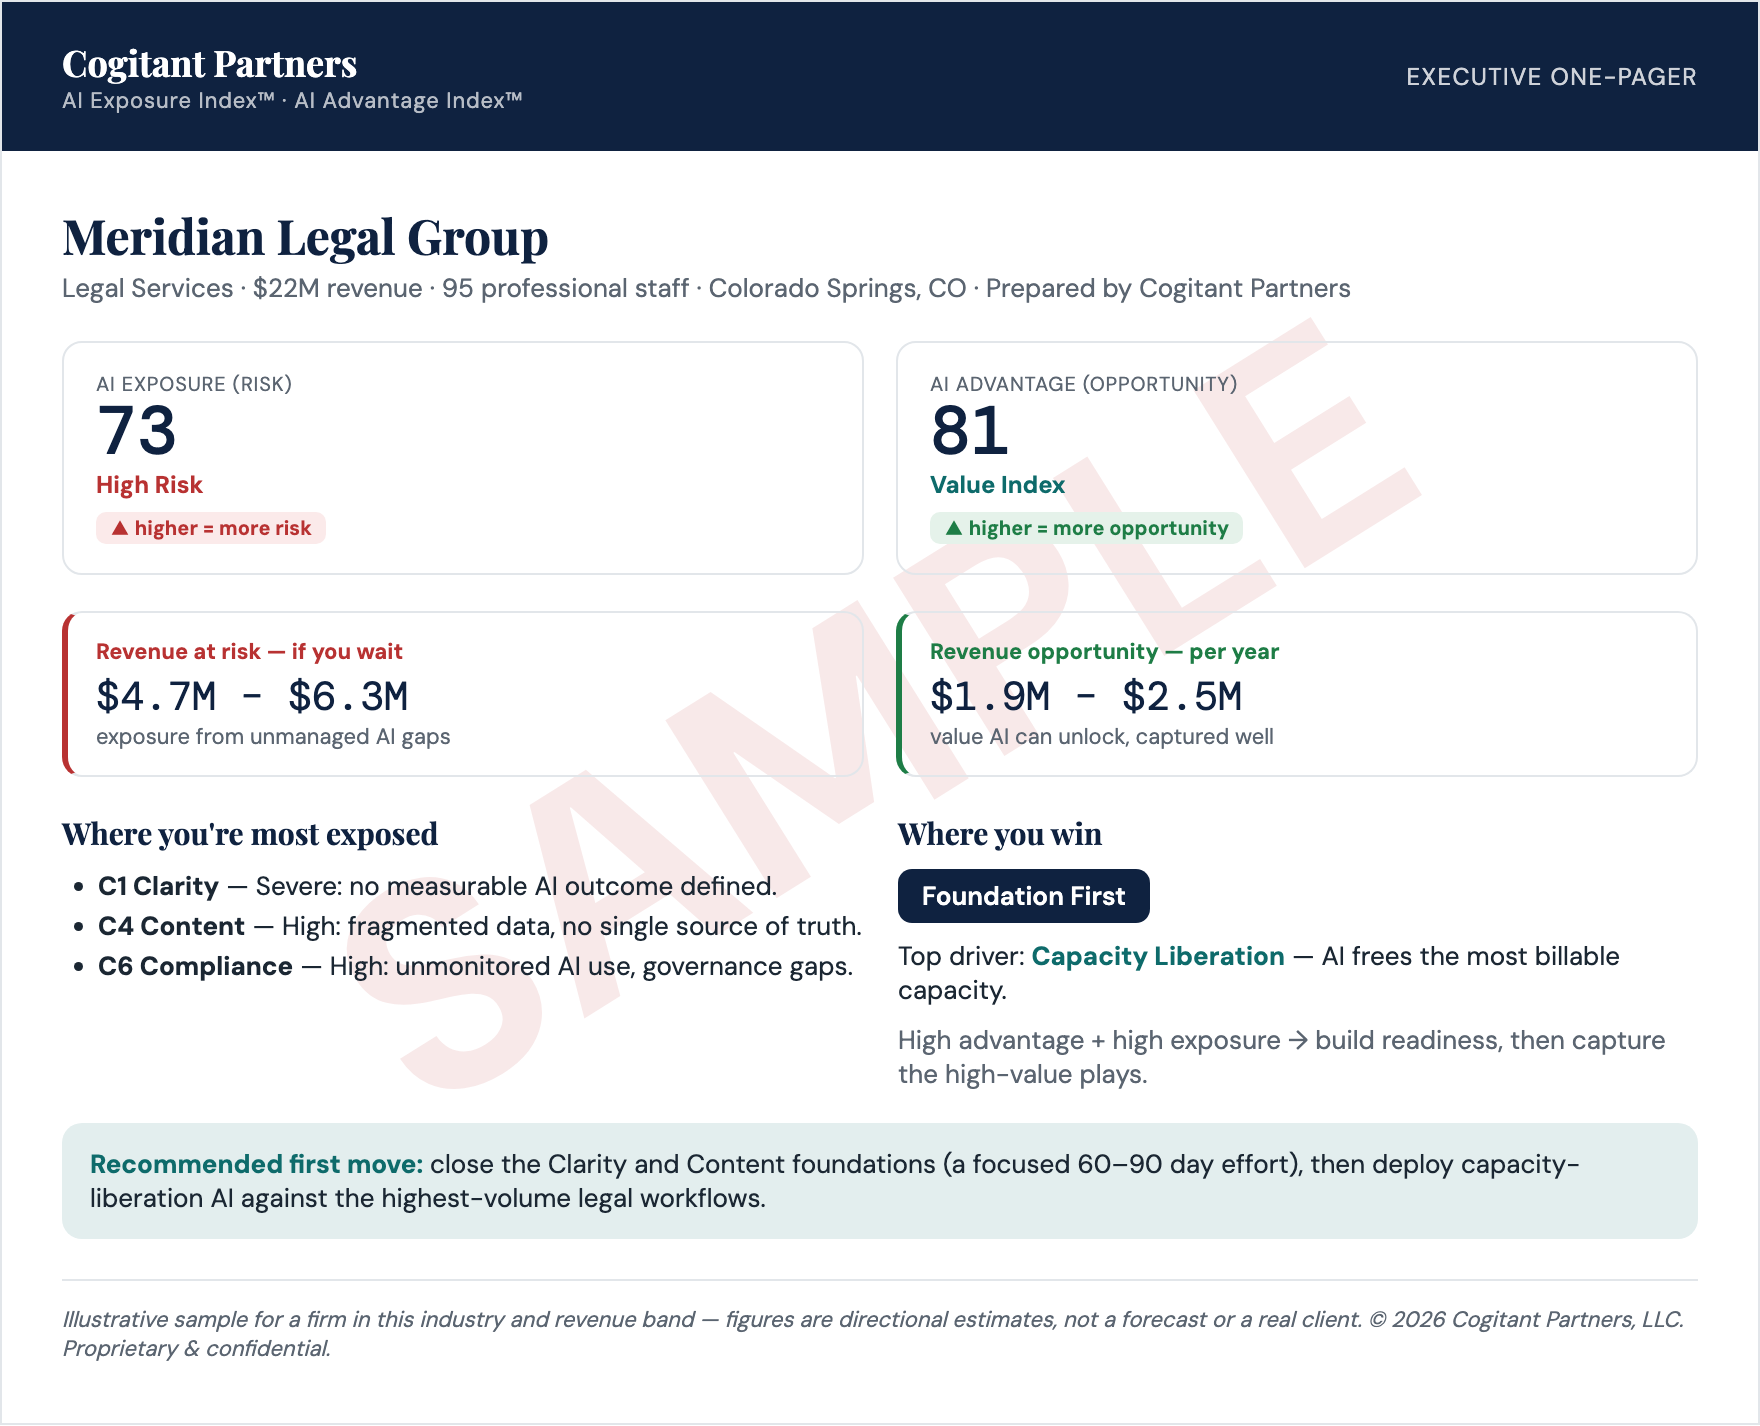
Executive One-Pager
The headline on one page: scores, revenue at stake & opportunity, top exposures, first move
View Full Size →
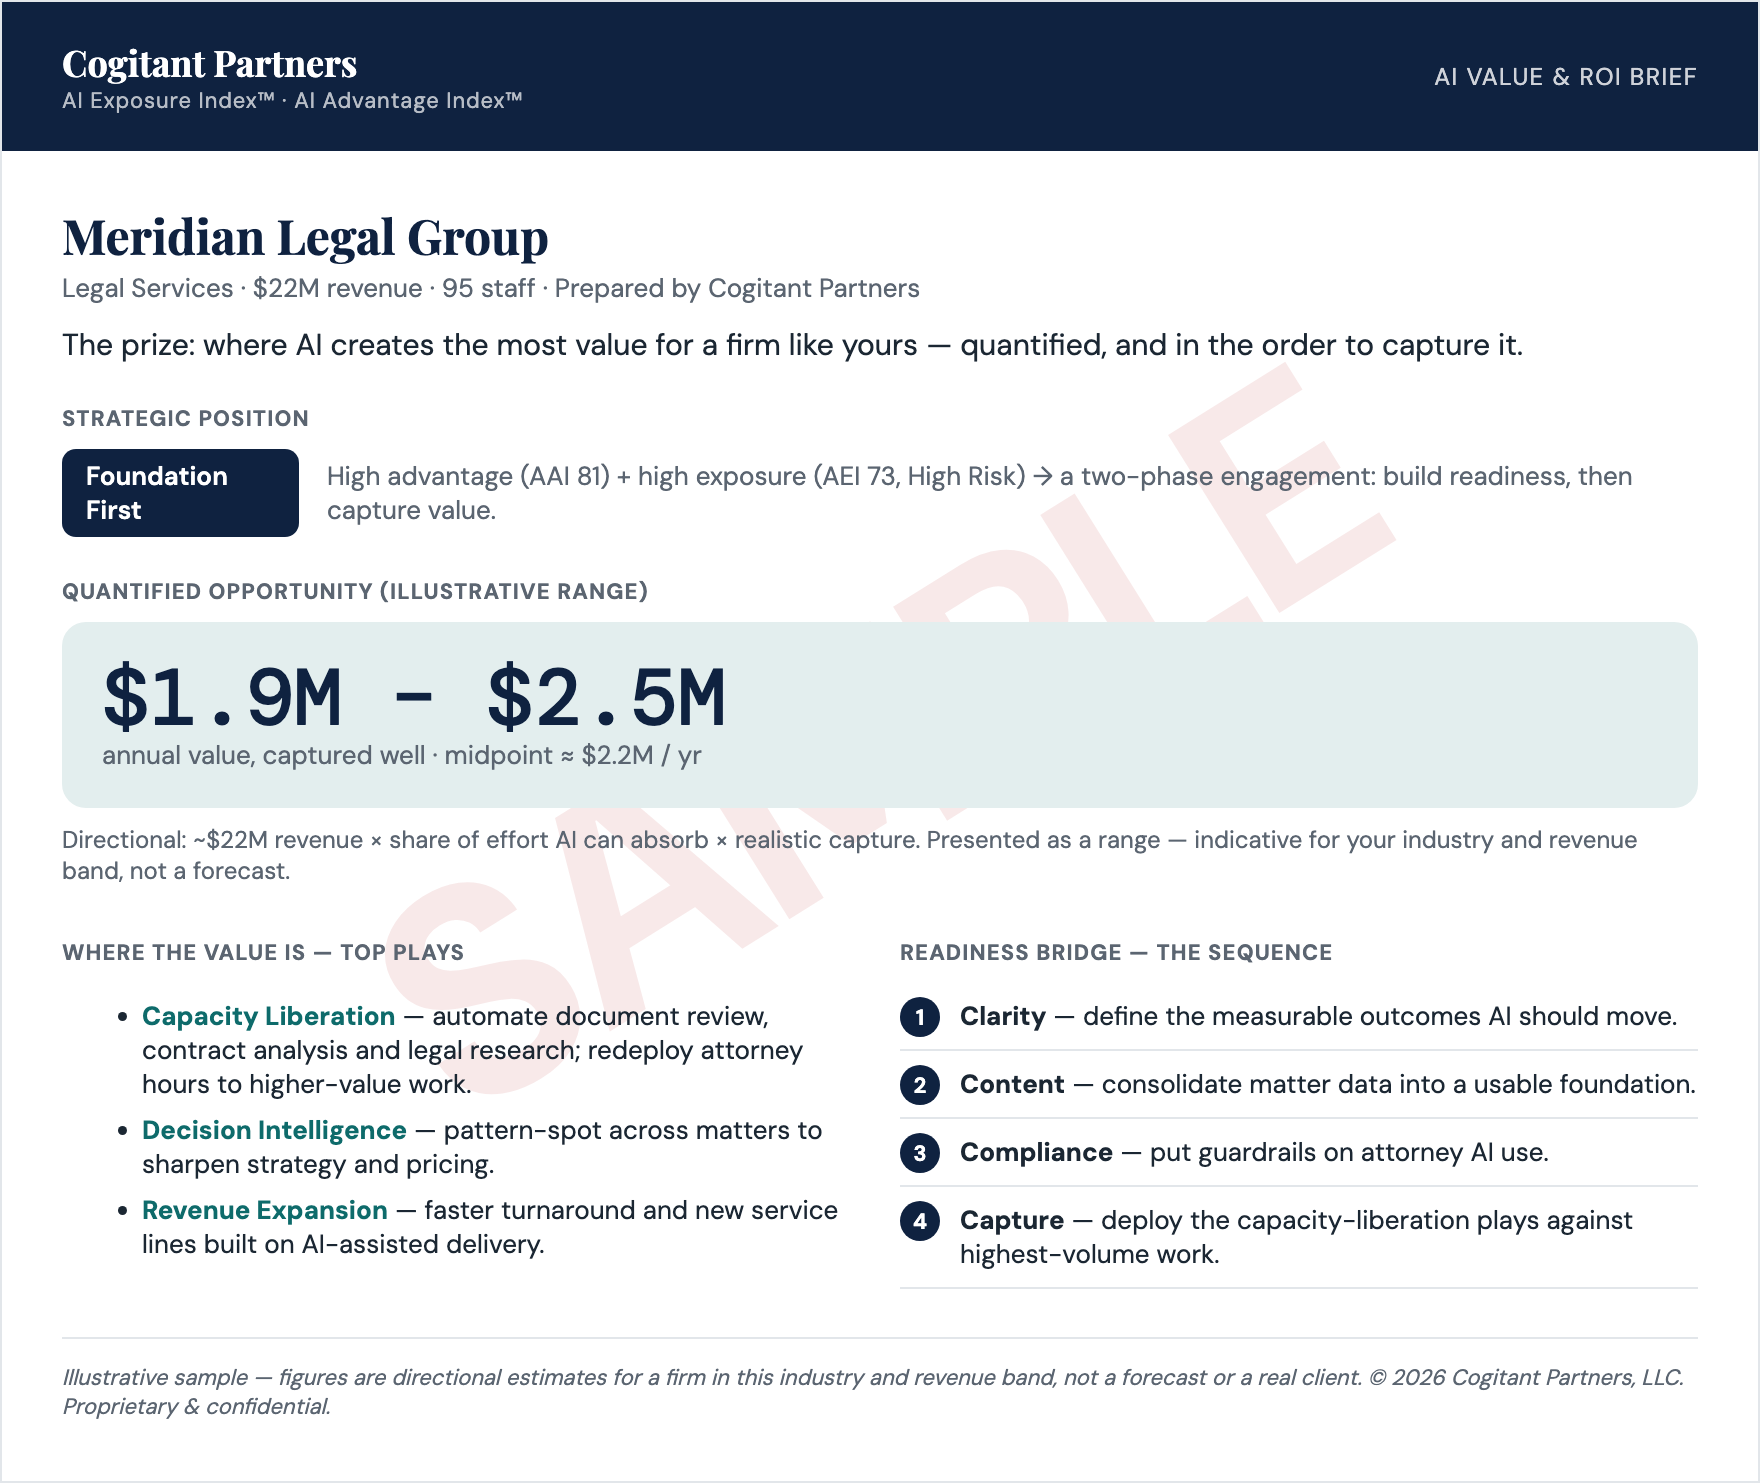
AI Value & ROI Brief
Where AI creates the most value — quantified — and the sequence to capture it
Take the full 2-minute tour →
These are static previews — the interactive tour walks through the full risk × advantage story end to end.
Ready to see your organization's score?
The Cogitant AI Exposure Index™ is a facilitated strategic engagement — not a self-serve survey. We work with you to gather the intelligence needed to score your organization accurately across all seven dimensions. Reach out to start the conversation.